Taaliku sadam
Saaremaa and Muhu · Väinameri
Page de ce port sur mervare.ee ↗
En bref
- 1.1 mPermitted draughtpilot book
- 42.5 mMaximum lengthregister
- 4 mMaximum beamregister
- 1.4 mQuay depthregister
- 1 mars – 1 décembreNavigation periodregister
Permitted draught is the limit the sailing directions publish for entering; quay depth is the register's figure for the deepest quay — other quays may be shallower. Neither guarantees a berth that suits your boat.
Services
- Shore powerUnknown
- WCUnknown
- ParkingUnknown
Tarifs et disponibilités
Tarif non publié — renseignez-vous auprès du port. Confirmez auprès du port les tarifs, les disponibilités à vos dates et les services inclus.
Convenez directement avec le port de votre emplacement, du tarif et de votre arrivée.
Arrivée
Saare maakond, Saaremaa vald, Pulli küla, Taaliku sadam, 94612
Environs du port
Ne pas utiliser pour la navigation. Voir tous les ports sur la carte.
View in Nutimeri (Transpordiamet, opens in a new tab) — Transpordiamet
Official navigation charts and markers, for information only — not a primary navigation aid.
Instructions nautiques
Based on a published sailing directions guideÀ utiliser avec une carte marine à jour et les avertissements de navigation.
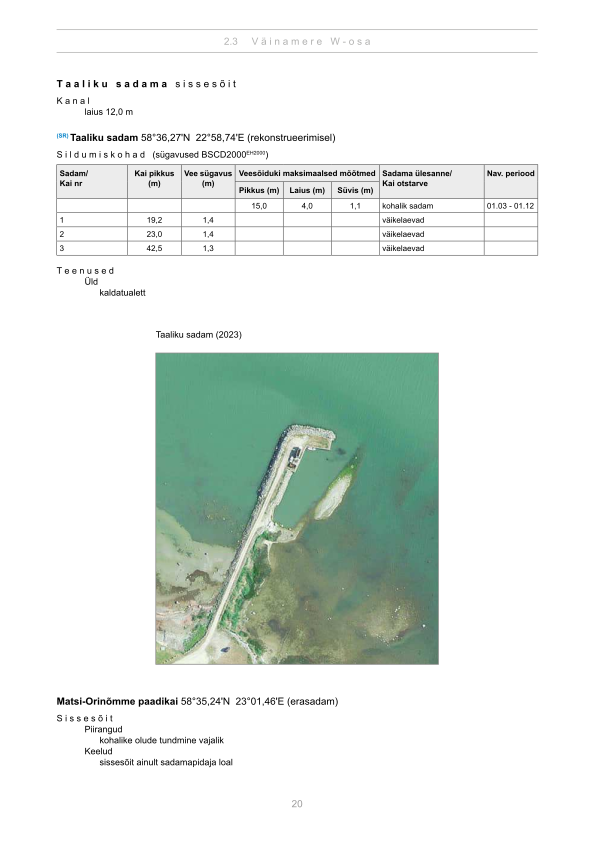
Depths and dimensional restrictions
The maximum permitted draught is 1.1 m. Published depths alongside are quay 1: 1.4 m, quay 2: 1.4 m and quay 3: 1.3 m. Depths are referenced to EH2000.[2]
Profondeurs par quai (3)
| quay 1 and 2 | 1.4 m |
|---|---|
| quay 3 | 1.3 m |
Sources
- Sailing directions Lootsiraamat 2.3 — Väinamere W osa
- Sailing directions Lootsiraamat 2.3 — Väinamere W osa
Publié le 12 Sept 2026 · révision 4
Statistiques historiques du vent
Prevailing winds
How often the wind blew FROM each direction, May–September 2021–2025.
Modelled data, not measured at the harbour
Rings: May (inside) → Sep (outside). Figure at the edge: share of the whole season.
The wind most often came from SW (12 % of the season's hours).
- under 3 %
- 3–6 %
- 6–9 %
- 9–13 %
- 13–20 %
- 20 % or more
Regional model data cannot show how sheltered the harbour is, or how the wind moves around its piers and breakwaters.
Data as a table
| Wind from | May | Jun | Jul | Aug | Sep | Season |
|---|---|---|---|---|---|---|
| N | 4.7 % | 4.0 % | 3.5 % | 3.8 % | 5.9 % | 4.4 % |
| NNE | 5.4 % | 3.9 % | 2.9 % | 2.7 % | 4.6 % | 3.9 % |
| NE | 5.0 % | 2.4 % | 4.1 % | 3.3 % | 2.2 % | 3.4 % |
| ENE | 3.6 % | 2.3 % | 4.8 % | 3.7 % | 3.1 % | 3.5 % |
| E | 4.1 % | 3.7 % | 4.0 % | 3.0 % | 4.2 % | 3.8 % |
| ESE | 3.9 % | 3.7 % | 3.8 % | 3.5 % | 6.7 % | 4.3 % |
| SE | 4.1 % | 3.6 % | 3.7 % | 5.6 % | 8.5 % | 5.1 % |
| SSE | 7.2 % | 7.4 % | 5.5 % | 7.6 % | 9.0 % | 7.3 % |
| S | 7.0 % | 7.1 % | 5.0 % | 8.2 % | 7.8 % | 7.0 % |
| SSW | 9.3 % | 6.3 % | 6.7 % | 8.7 % | 7.2 % | 7.7 % |
| SW | 8.5 % | 13 % | 17 % | 13 % | 10.0 % | 12 % |
| WSW | 8.7 % | 12 % | 14 % | 11 % | 7.9 % | 11 % |
| W | 6.1 % | 7.9 % | 8.0 % | 7.6 % | 6.5 % | 7.2 % |
| WNW | 6.6 % | 6.9 % | 6.0 % | 7.9 % | 4.5 % | 6.4 % |
| NW | 8.7 % | 8.9 % | 5.2 % | 5.6 % | 5.1 % | 6.7 % |
| NNW | 6.6 % | 5.9 % | 5.7 % | 4.5 % | 6.8 % | 5.9 % |
| calm | 0.4 % | 0.7 % | 0.4 % | 0.3 % | 0.2 % | 0.4 % |
| % | 100 % | 100 % | 100 % | 100 % | 100 % | 100 % |
Calm: below 0.5 m/s; counted in the total, not in any direction. 18360 valid hours of 18360 expected.
Source: ERA5 reanalysis (ECMWF / Copernicus Climate Change Service), ~25 km grid · model grid point 11.7 km south of the harbour (58.500, 23.000) · May–September 2021–2025, UTC · 18360 valid hours of 18360 expected · Data retrieved 2026-10-07 · Contains modified Copernicus Climate Change Service information (ERA5), CC BY 4.0
Données : sources publiques, fiche mise à jour le 17 Nov 2025.
Visitor observations
Sailors' experiences, not the harbour's official information.
Informations pratiques et documents du port
- Adresse
- Saare maakond, Saaremaa vald, Pulli küla, Taaliku sadam, 94612
- Période de navigation
- 1. märts - 1. detsember
- Position
- 58.60457° N, 22.97920° E
- Téléphone
- +372 53452698
- urmasmagi1963@hot.ee
Tous les services publiés
Veesõiduki lastimine ja lossimine · Veesõiduki sildumise võimaldamine · Parkla · WC · Elekter
Ports les plus proches
Distance à vol d’oiseau. Le plus proche n’est pas forcément adapté à votre bateau.
Saaremaa, Muhu, Abruka and Vilsandi. Depths in the Väinameri are modest — draft is the binding constraint here. Tous les ports : Saaremaa and Muhu →
Suggest a video for this harbour
Add a 3–30 second video file or a YouTube link. Videos are reviewed before publication; a suitable short clip may become the page hero.